
I do shows all over Durban and surrounds – but where exactly? And which areas are the most lucrative? To work that out I made an interactive Desktop app using Processing and the Modest Maps library. To get the points on the map I used Google Geocoding api.
How it works
The process is quite simple, I create a csv file from our records, with the customer address and total invoice amount in columns (as well as blank latitude and longitude columns).
I created a start screen to choose which csv to use for the visualisation, with an option to fill in the locations using Google geocoding* api.
*geocoding is taking an address and turning it into location co-ordinates.

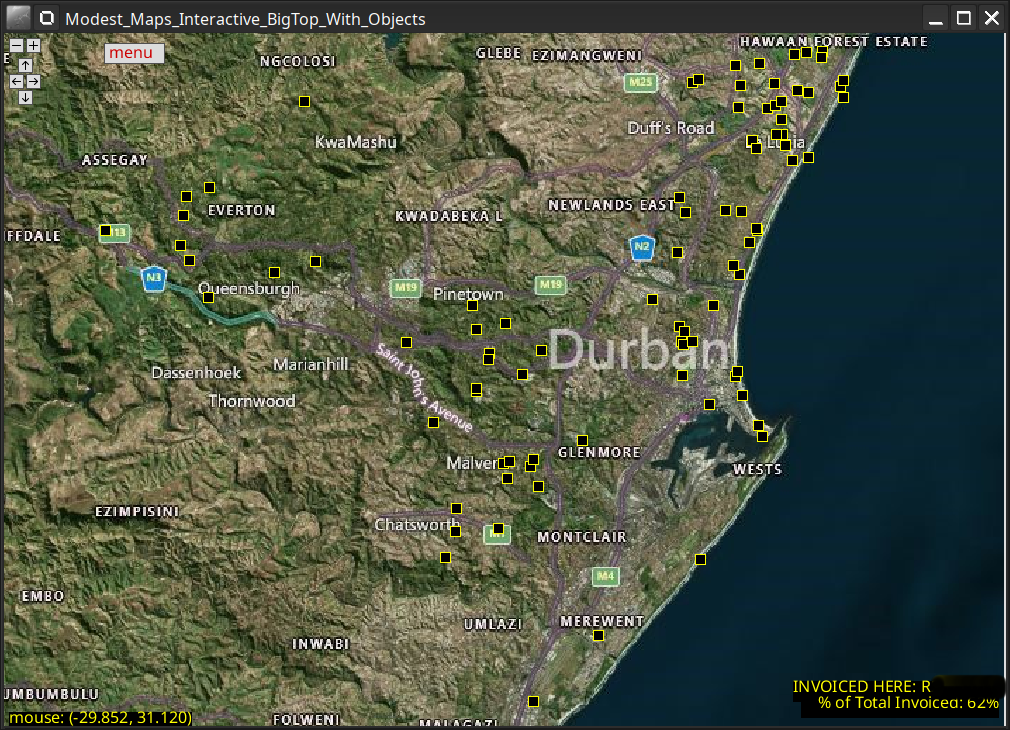
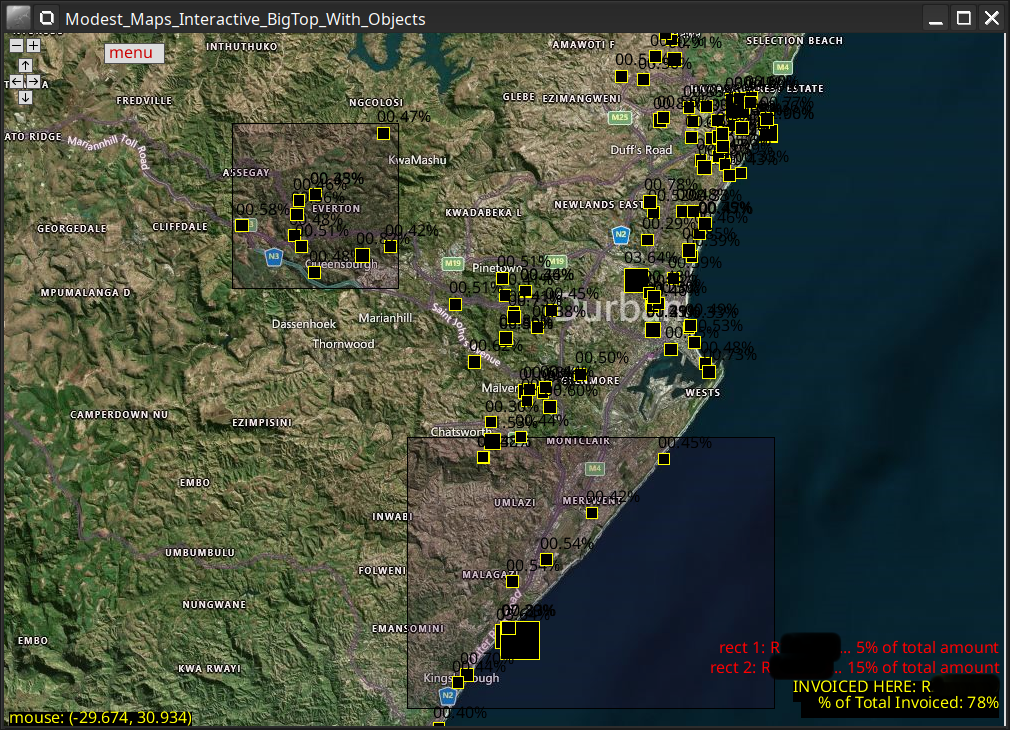
Once the geocoding is done, there are two options, map or details. The details page is basically the same but the points are larger or smaller depending on the amount.
Google geocoding is not completely accurate, so there is a bit of csv editing still to be done – some addresses may appear in different countries for example. Luckily fixing this manually is quite straightforward, you just find the correct location on google maps and then copy the “lat” and “lon” parts of the url from the browser address bar (just after the @ symbol).
The “Modest Maps” library for Processing has many options for tiling – I switched to the satellite view for the screenshots above, to avoid giving away sensitive information. Usually I use a street map view of course.
Purpose and functionality
The purpose of this app is mainly to see where all of our customers are booking us. This information is useful for marketing. When the program is running, two boxes can be drawn around areas on the map, and the text at the bottom compares the total invoice amount within those boxes. The map can be zoomed and panned, and a total for the whole page (with percentage) is shown for reference.
More possibilities
Since the pandemic is effectively over and we are back to full strength in terms of bookings, these statistics are now valuable again for my entertainment business. I plan on extending this simple app with more statistical visualisations – perhaps a colour map of distance from my house, and also pairing it with a database and more fields, like dates and type of booking. I could also automate the data entry, although that is rather trivial with a bit of spreadsheet manipulation, and I only really look at this a few times per year.